Financial Summary
Financial Highlights (Consolidated Statement)(Unit: million yen)
|
2020/12 |
2021/12 |
2022/12 |
2023/12 |
2024/12 |
| Net sales |
288,332 |
317,695 |
352,300 |
381,989 |
405,477 |
| Operating income |
31,290 |
34,518 |
33,807 |
40,877 |
48,021 |
| Ordinary income |
31,425 |
33,618 |
32,813 |
40,734 |
47,389 |
| Net income attributable to owners of parent |
20,186 |
23,945 |
19,937 |
25,163 |
31,961 |
| Total net assets |
175,081 |
194,222 |
206,724 |
226,673 |
253,044 |
| Total assets |
232,984 |
260,113 |
277,365 |
311,393 |
337,094 |
| Net assets per share (yen) |
1,316.81 |
1,460.77 |
1,554.8 |
1,704.84 |
1,903.18 |
| Net income per share (yen) |
151.83 |
180.1 |
149.96 |
189.26 |
240.39 |
| Equity ratio (%) |
75.1 |
74.7 |
74.5 |
72.8 |
75.1 |
| Return on shareholder's equity (%) |
12.1 |
13.0 |
9.9 |
11.6 |
13.3 |
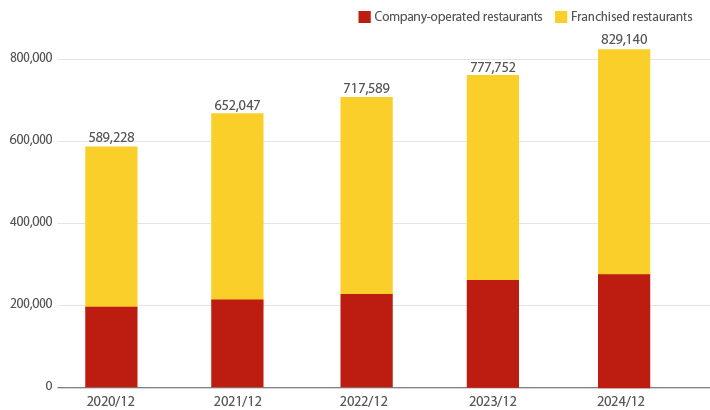
All Stores Sales (System-Wide Sales)(Unit: million yen)
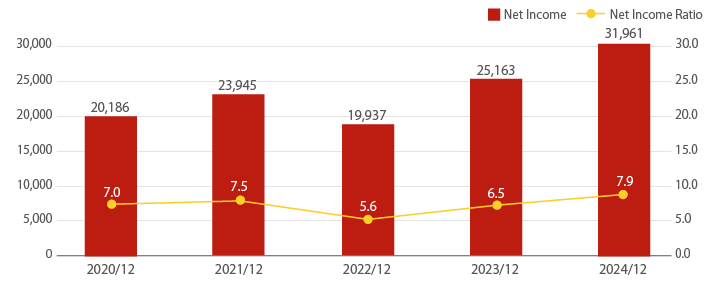
Consolidated Net Income(Unit: million yen)
Consolidated Balance Sheet (Summary)(Unit: million yen)
| Item |
The 54th
As of December 31, 2024 |
| Assets |
Current assets |
111,677 |
| Non-current assets |
225,416 |
| Total assets |
337,094 |
| Liabilities |
Current liabilities |
76,069 |
| Non-current liabilities |
7,981 |
| Total liabilities |
84,050 |
| Net assets |
Shareholder’s equity |
257,171 |
| Accumulated other comprehensive income loss |
△4,126 |
| Total net assets |
253,044 |
| Total liabilities and net assets |
337,094 |
Consolidated Statements of Income (Summary)(Unit: million yen)
| Item |
The 54th
From January 1, 2024 to December 31, 2024 |
| Net sales |
405,477 |
| Cost of sales |
324,489 |
| Gross profit |
80,987 |
| Selling, general and administrative expenses |
32,966 |
| Operating income |
48,021 |
| Non-operating income |
1,706 |
| Non-operating expenses |
2,338 |
| Ordinary income |
47,389 |
| Special income |
1,660 |
| Special loss |
1,822 |
| Income before income taxes |
47,226 |
| Current taxes |
15,090 |
| Deferred taxes |
174 |
| Net income attributable to owners of parent |
31,961 |
Consolidated Statement in Cash Flows (Summary)(Unit: million yen)
| Item |
The 54th
From January 1, 2024 to December 31, 2024 |
| Net cash provided by operating activities |
52,689 |
| Net cash used in investing activities |
△44,764 |
| Net cash used in financing activities |
△5,839 |
| Cash and cash equivalents at end of period |
67,327 |
